You look at your nautical chart and see sharks teeth just inside the beach line? What do these mean and how can your best use them to advantage in your chart navigation? Unlock the mystery of land profile chart symbol secrets to boost your skipper-skills sky-high!
Choose an anchorage, land a dinghy onto a beach, or make a passage through a coral reef or chain of islands. All of these require a keen sense of land profile identification. Use these illustrations and descriptions to help you make the best sailing navigation choices when approaching land.
Smooth Lines for Beach Landings

Notice the solid black line inside the yellow circle. This shows the high tide mark of a flat beach area. In a pinch, if you had to land a dinghy along a barren coast, look for these areas first. Notice on the north and south side of the landmass, rocks (shown as “asterisk” or “plus-sign” symbols) lurk just beneath the waves.
Green Monsters and Rocky Roads

Keep clear of green tinting. This tongue shows a mud flat, but green areas can also signal sand bars, coral heads, oyster beds, or other dangerous bottom characters. Use extra caution when navigating in areas where you see gaps between green tinted blobs. These could indicate rip currents or breakers.
The underlined numbers in parentheses tell you how much rock you will see above the water at the charted depth datum. On this chart, depths are shown at low tide. This illustration shows rocks that will poke up 2 feet (2) or 1 foot (1) above the water at low tide.
Hidden Dangers and Peaking Points

Check out the squiggly boundary that chart makers have drawn around this dangerous shoal. This means that this shoal covers and uncovers with the tide. At high tide, it will be covered, or become invisible. At low tide, it will uncover, or become visible.
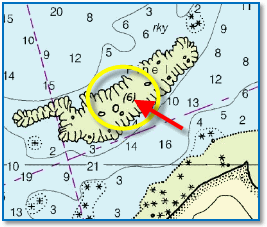
Look at the small smooth circles inside the yellow circle. These are islets–or small islands. Because they are drawn with smooth lines (not squiggly), this indicates that they are visible at all stages of the tide.
The number in parentheses tells you how much of the islet you will be able to see above the water at the charted height datum. On this chart, heights are shown at high tide. Thus, the islets in the illustration will poke up 6 feet (6) above the water at high tide.
Shark-Tooth Cliffs Near the Beach

Look just inside the beach line at the serrated, shark-tooth symbols. These show high cliffs. In calm weather, these can give shelter, but storms could cause “cliff effect” winds that scream down the side of the cliff and hit the water with gale force winds. In heavy weather, keep clear of cliff walls.
Mountain Contours and Tall Peaks

High mountains and volcanoes often have elevations written somewhere along the contour. These mountains on Angel Island in San Francisco Bay show elevations of 200, 300, and 500 feet. You can pick up some mountain peaks on a small boat radar from 20 nautical miles away in perfect atmospheric conditions. Read more:
https://www.skippertips.com/public/1129.cfm


