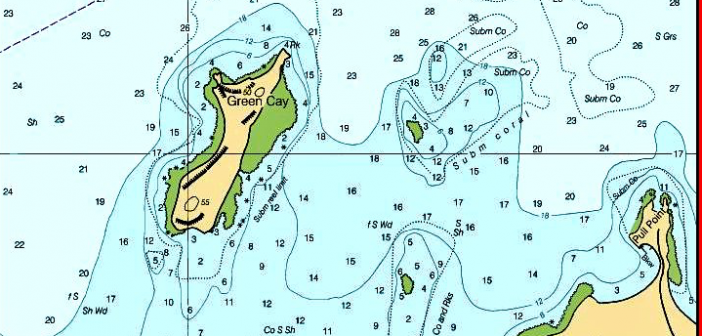
Here’s some great advice from Skipper Tips about how to stay off the rocks, or reefs, or even mud flats, that can be hidden at high tides. Take a look, and remember how to read your charts to stay safe:
Look at your chart or plotter software and note any areas tinted in shades of green. These are “inter-tidal” areas that cover and uncover based on the state of the tide. These sand bars, marshes, mud flats, oyster beds, coral reefs, shell or rocky bottoms will often be hidden at higher stages of the tide.
They may be visible at lower stages, but it’s best not to bet your boat on it. Indeed, at neap tides that occur twice each month (at the quarter moon phases), tides will be higher than normal at low tide and lower than normal at high tide. On the other hand, spring tides that occur twice each month (at the full and new moon phases) create lower low tides and higher high tides.
Plan for this when sailing or cruising. Give a wide berth to any intertidal area within two miles of your sailing track line, in particular to leeward. Highlight green tinted areas and pass the word to your sailing crew or partner to increase fix (position) frequency. Now, let’s take a look at three specific chart symbols that you may encounter while sailing or cruising.
Note the three columns in the illustrations below. The first column shows the default International symbols agreed upon by nations throughout the maritime world. Think of chart symbols in the first column as basic “foundation” symbols. These symbols may be modified a bit as shown in columns two and three.
The second column shows the slight modifications you will find on nautical charts from the National Oceanic and Atmospheric Administration (NOAA). You’ll also find these symbols on charts from the National Geospatial-Intelligence Agency (NGA).
The third column shows NGA chart symbols with subtle differences from the second column that may be displayed on some of their charts. If this column has been left blank, then all NGA charts will show those nautical chart symbols shown in the second column.
Gravel and Stone Dangers of the Deep

https://www.skippertips.com/public/2063.cfm


